What is Business Intelligence (BI)?
Data alone doesn’t drive decisions. Intelligence does.
Our BI experts turn raw data into real-time, AI-powered insights that drive clarity, speed and action.
Forget static dashboards. We help businesses anticipate trends, optimize performance and make smarter decisions faster with AI-powered analytics.
Our Solutions
Business Performance Dashboards & Extensions
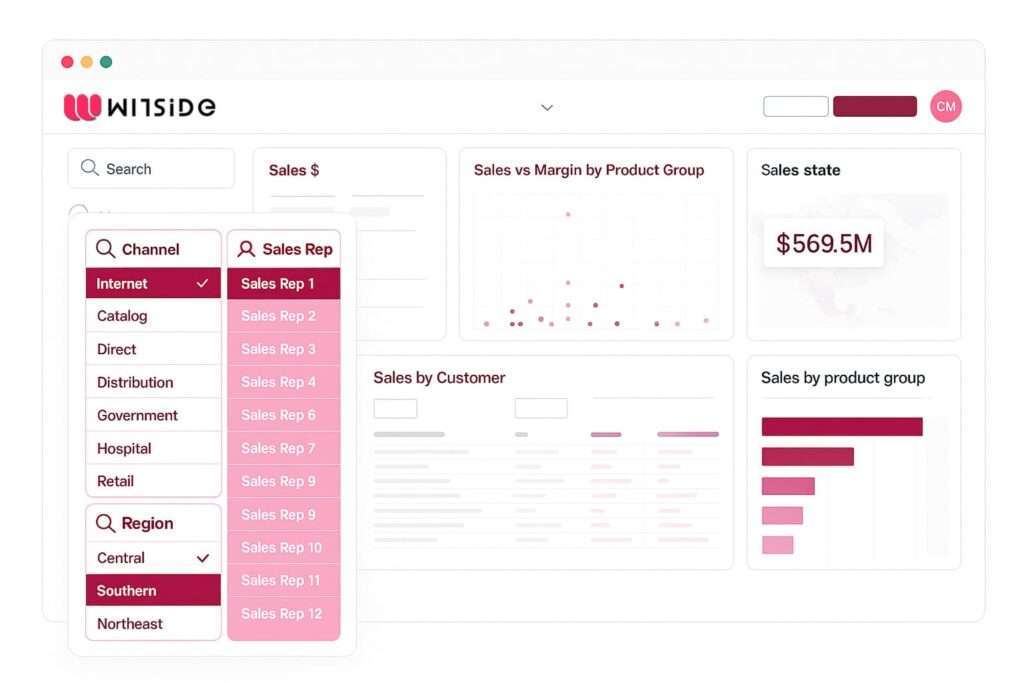
Our business performance dashboards provide a consolidated, real-time view of your organization’s most critical metrics, ensuring that decision-makers have instant access to actionable insights at a glance.
AI-Powered Analytics
AI is transforming analytics, making it faster, more intuitive and more impactful. With AI-powered analytics, businesses can automate insights, uncover patterns, and make faster and more accurate decisions.
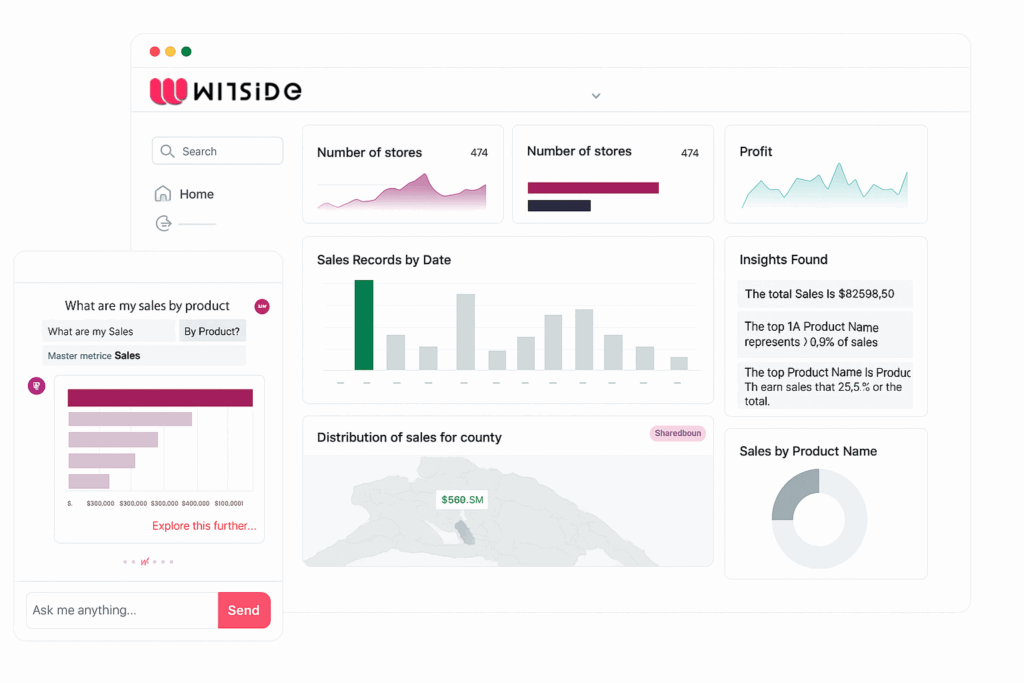
Predictive AI
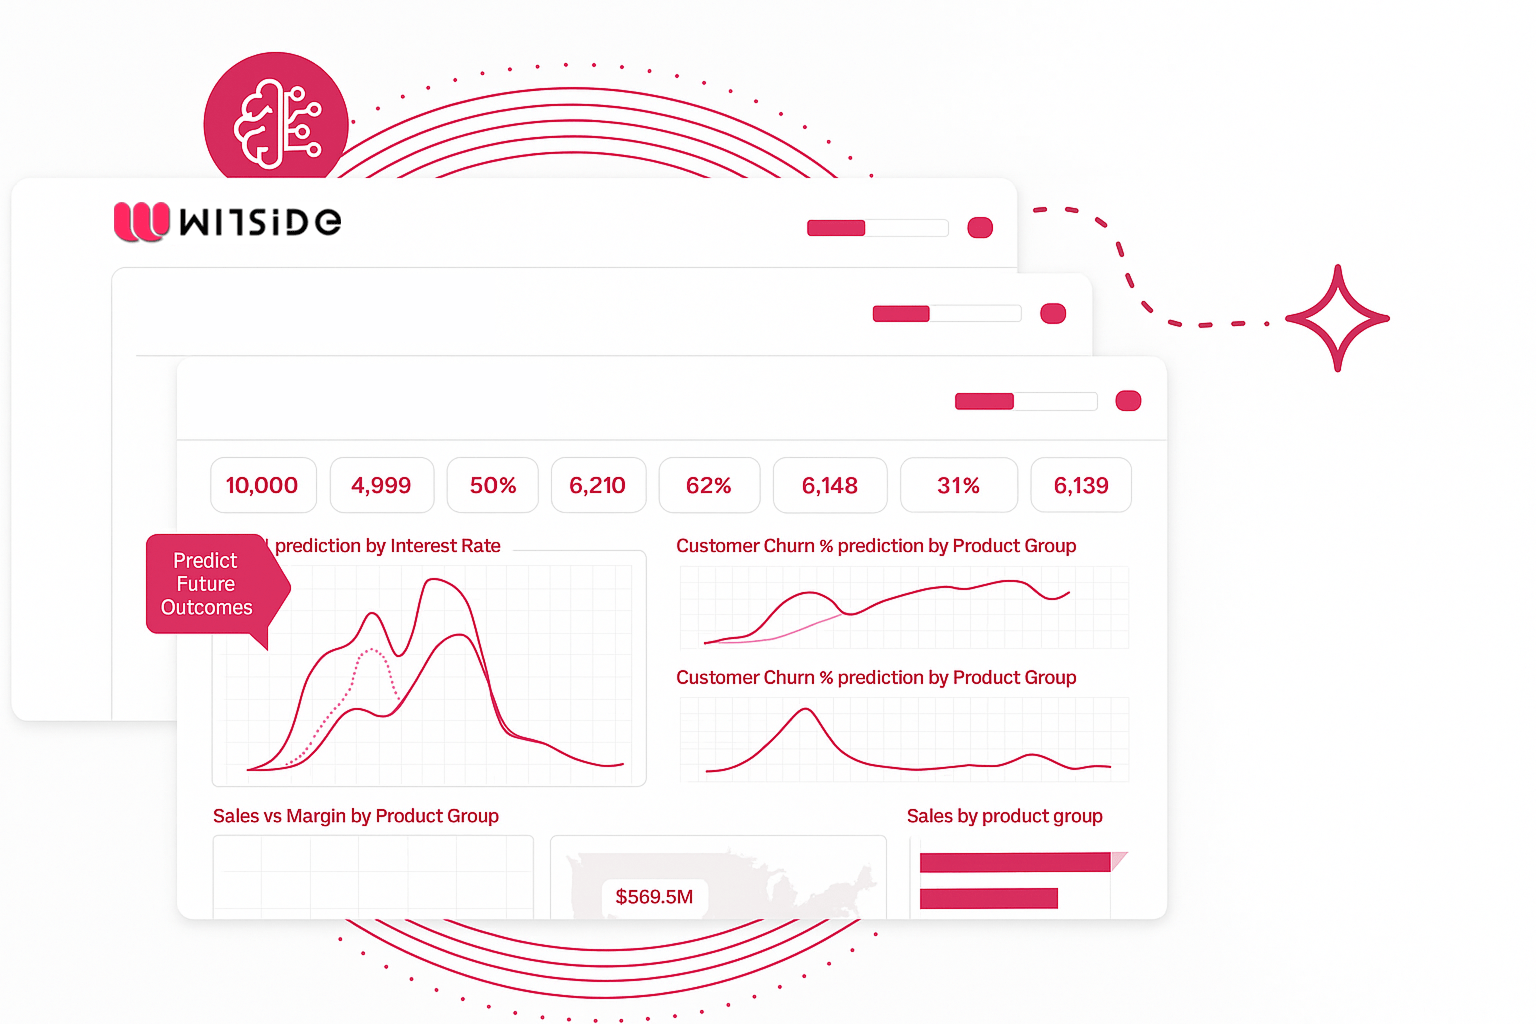
Stay ahead of the curve with Predictive AI, which empowers your business to forecast trends, optimize decisions, and drive measurable impact with no code. Predict, explain, and act with confidence.
Generative AI
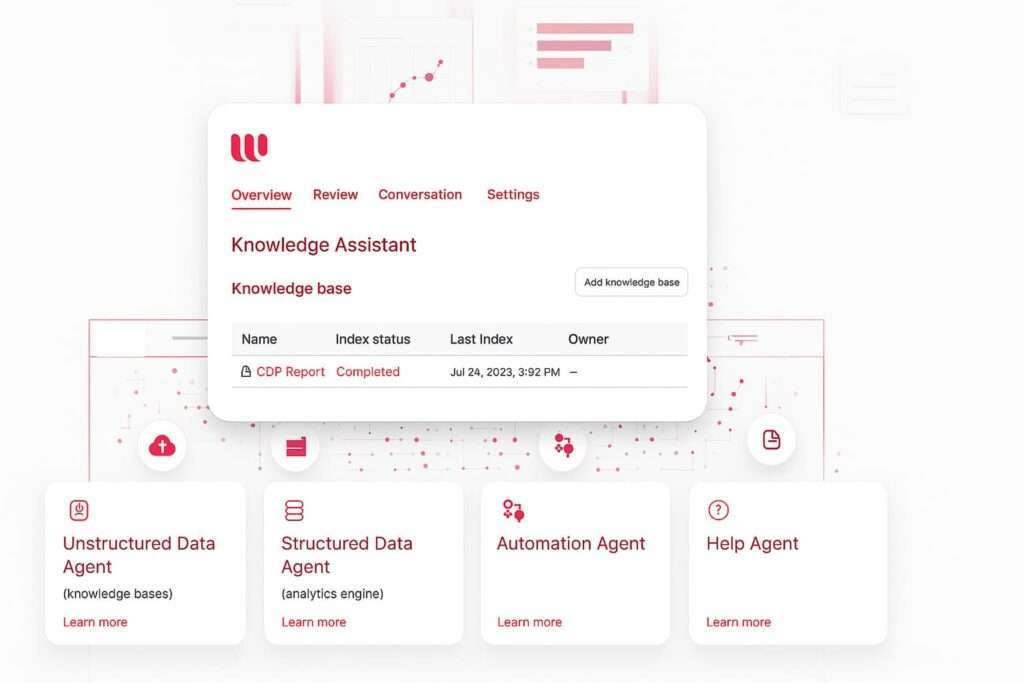
Deliver real-time, custom insights from both structured and unstructured data. With intelligent automation and natural language processing, you can get fast, reliable answers, enabling smarter, data-driven decisions with minimal effort.
Case Studies
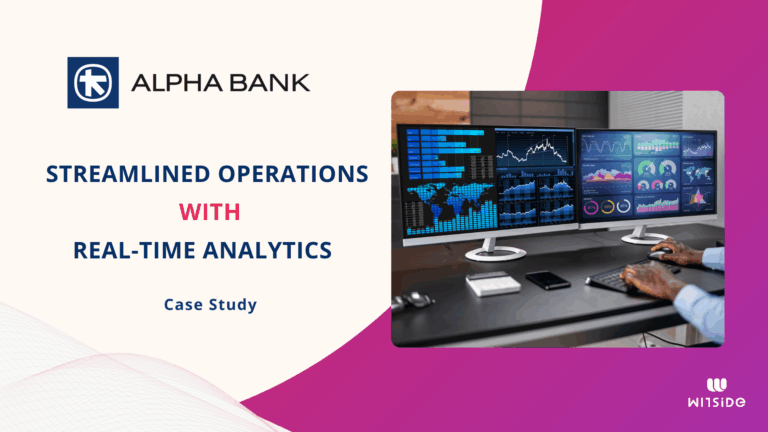
See how we’ve helped companies in Greece and abroad achieve digital transformation across leading industries, including energy, oil & gas, retail, and tourism.
- BI, Data Management
- Advanced Analytics
- BI, Data Management
Unlock the Benefits of Next-Gen BI with WITSIDE
The future belongs to businesses that don’t just collect data, but act on it.
Smarter Decisions
AI-powered insights deliver clarity and speed, enabling confident, data-driven choices in real time.
Efficiency Boost
Automate manual reporting and analysis to accelerate workflows, free up resources, and minimize human error.
Real-Time Visibility
Track key metrics across departments instantly, empowering teams to respond to change as it happens.
Cost Optimization
Identify inefficiencies and improve resource allocation through data-backed intelligence.
Seamless Collaboration
Break silos by making insights easily accessible across teams, enhancing alignment and faster execution.
Stronger Customer Insights
Understand behavior at every touchpoint to personalize journeys, improve satisfaction, and build long-term loyalty.
Want to learn more?
Tools & Technologies We Use
We leverage the best data analytics tools to predict the future and drive business success.
WITSIDE is a Master Reseller of Qlik Sense in Greece. This leading BI platform combines powerful data integration with AI-powered analytics.
Microsoft’s Power BI provides robust data analytics and reporting features, seamlessly integrating with other Microsoft tools for enhanced productivity.
This powerful financial reporting and performance management tool leverages your existing financial systems to speed up processes and increase accuracy.
What Our Clients Say


FAQs
How can data visualization help my team make faster decisions?
Data visualization simplifies complex datasets by presenting them visually, making it easier for teams to understand key metrics at a glance. This reduces the time spent analyzing raw data and enables faster, more confident decision-making by highlighting trends and patterns that are immediately actionable.
What’s the difference between static and interactive data visualizations?
Static visualizations are fixed representations of data, such as printed charts or reports, which offer a snapshot of information at a specific time.
Interactive visualizations, on the other hand, allow users to explore data by filtering, drilling down, and adjusting views in real-time, making them more dynamic and useful for in-depth analysis.
What are common data visualization requirements for a successful BI project?
The key data visualization requirements for a successful BI project include:
🚀 Accurate, high-quality data integration.
🚀 Clear and intuitive data visualization design.
🚀 Flexibility to customize dashboards to meet business needs.
🚀 Accessibility across devices, enabling decision-makers to view data visualized in real-time, regardless of location.
🚀 Financial data visualization to keep a close watch on revenue, expenses, and performance indicators.
How do business intelligence and data visualization work together?
Business intelligence (BI) and data visualization work together by turning raw data into meaningful insights that are easy to understand and act upon. BI systems gather and analyze data from various sources, such as sales, operations, and customer feedback, and then use data visualization to present these insights in a visual format, such as charts, graphs and dashboards.
Here’s how they complement each other:
🚀 Data Collection & Analysis (BI): BI tools collect and process data from multiple sources, performing complex calculations and analysis to identify trends, patterns, and key performance metrics.
🚀 Visualization (Data Visualization): Once the data is processed, data visualization tools convert these findings into visual elements that are easy to interpret. Instead of sifting through raw numbers or reports, users can quickly see insights visually represented in real-time.
🚀 Decision-Making: The combination of BI and data visualization allows stakeholders to make faster, more informed decisions. Visual representations make it easier to identify trends, spot anomalies, and understand performance at a glance.
Together, BI and data visualization provide a complete picture of business operations, enabling organizations to monitor performance, track KPIs, and respond swiftly to data-driven insights.
How secure is the data used in BI dashboards?
Data security is a top priority in BI systems. Advanced BI tools typically include robust security protocols such as encryption, user authentication, and access control, ensuring that sensitive data is protected. Role-based access also limits data visibility to authorized personnel only.
What are the common challenges when implementing BI and data visualization solutions?
Common challenges include data integration from multiple sources, ensuring data accuracy and consistency, user adoption of new tools, and aligning visualization design with business goals. These challenges can be mitigated by selecting the right BI tools and working with experienced BI and data visualization partners to guide implementation.
How can advanced BI and data visualization help with financial reporting?
Advanced BI tools and financial data visualization streamline financial reporting by providing real-time visual insights into financial performance. These dashboards consolidate financial data into easy-to-understand visuals, helping executives track expenses, cash flow, and profitability. With intuitive data visualization design, finance teams can forecast trends, monitor budgets, and spot inefficiencies quickly and accurately.
Advanced Analytics
Leverage cutting-edge Advanced Analytics techniques to predict trends, optimize operations, and enable data-driven innovation that propels your business into the future.
Data Management
Ensure data integrity, accessibility, and compliance with robust management strategies,
unlocking the full potential of your data for smarter, more informed decisions.
AI-Powered Analytics
AI-powered analytics bridges the gap between data and decision-making, ensuring that every insight is clear, contextual and actionable.
With Qlik’s Insight Advisor, users can search, ask and interact with data easily, receiving AI-driven recommendations, automated insights and smart visualizations.
🚀 Automated Insights: Perform drag-and-drop analysis with 20+ advanced techniques, from clustering and correlation analysis to time-series forecasting.
🚀 Natural Language Analytics: Ask questions, search for insights and receive AI-generated responses in everyday language with Insight Advisor Search & Chat.
🚀 AI-Assisted Authoring: Get smart suggestions for charts, key drivers, and visualizations tailored to your data.
🚀 Seamless AI Integration: Enhance workflows with proactive alerts, contextual recommendations, and associative insights that uncover hidden relationships in data.
Business Performance Dashboards & Extensions
Waiting for reports is no longer an option.
Our Business Performance Dashboards bring real-time visibility into your most critical metrics, allowing decision-makers to act with speed and confidence.
By consolidating data from multiple sources, we turn complexity into clarity, helping you predict trends, uncover inefficiencies and optimize performance in one unified view.
Our Data Visualization Extensions, like Vizlib for Qlik Sense, take BI beyond basic charts, transforming raw data into actionable insights. From customizable dashboards to write-back capabilities, Vizlib enhances collaboration and empowers teams with deeper data exploration.
🚀 Engaging visual storytelling: Communicate insights with dynamic, intuitive dashboards.
🚀 Real-time collaboration & write-back: Interact, annotate, and share updates seamlessly.
🚀 Self-service customization: Empower teams with flexible, user-friendly tools.
🚀 Seamless export: Convert insights effortlessly into PDF, Excel, or PowerPoint.
Predictive AI
Anticipate what’s next and take the right actions.
Stay competitive, agile, and always one step ahead.
Qlik Predict™ brings the power of predictive analytics to everyone – no coding required. Designed for business users and analysts, it enables organizations to forecast trends, identify key drivers and mitigate risks before they escalate.
Go beyond static reporting. Generate accurate predictions, understand the ‘why’ behind every outcome and take proactive steps with explainable, automated machine learning.
🚀 Predict: Forecast key business metrics with AI-powered accuracy.
🚀 Explain: Gain trust in AI-driven insights with transparent, interpretable models.
🚀 Act: Deploy predictive insights directly into your workflow to drive smarter, faster decisions.
Generative AI
AI-powered insights. Less searching, more decision-making.
Qlik Answers redefines self-service analytics by integrating natural language processing (NLP) and AI-driven automation, allowing users to ask questions and receive instant, relevant insights.
Stop navigating through endless reports. Simply ask, and Qlik Answers delivers.
Whether surfacing critical reports, summarizing key findings or generating real-time insights, it transforms raw data into clear, actionable intelligence.
🚀 Ask & Discover: Use conversational analytics to get instant, AI-generated answers.
🚀 Context-Aware Insights: Analyze both structured and unstructured data in real time.
🚀 Explain & Act: Gain fully explainable insights that fuel confident decision-making.


