

Here, are some of the many tips and tricks that you can implement in your Qlik Sense applications. The goal is to show you tips that can make your job easier and to highlight features that are not intuitive to find. The most anticipated article is here to make your job routine easier. So, let's start!
8.Vertical filter pane with values
Use the filter pane one grid high and change the label to : =concat(distinct Year,' | ').

Image 6
9.Different markers per line
Add two measures, one for line and one for the symbol. Use master measures to keep colors consistent.
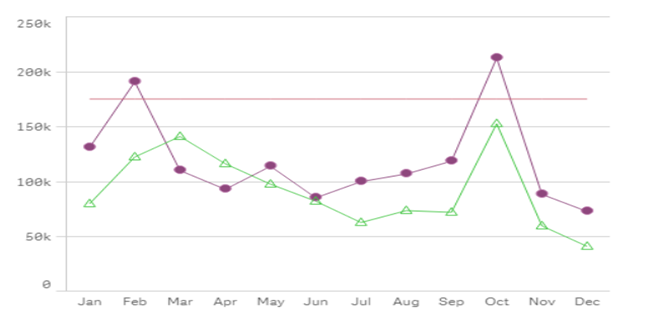
Image 7
10. Chart with annotations
Use the combo chart and custom marker layers on a secondary axis. Add a custom expression for the marker and the label. Tweak the axis and the expression to get the markers on the right place.
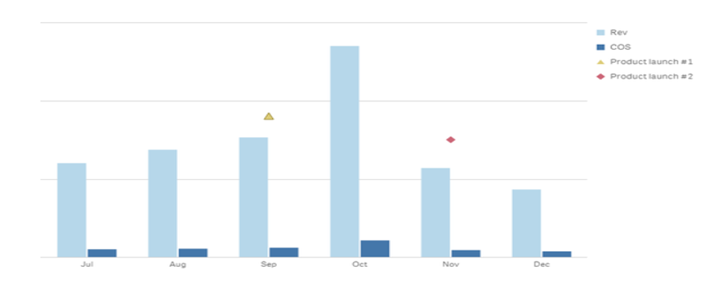
Image 8
11. Best-selling combinations
Create a copy of the combination field in the load script, in this case ProductNames, as Duplicate. Add to a pivot table, use ‘count(distinct TransactionID)’ as measure, mask duplicates values with white text color.
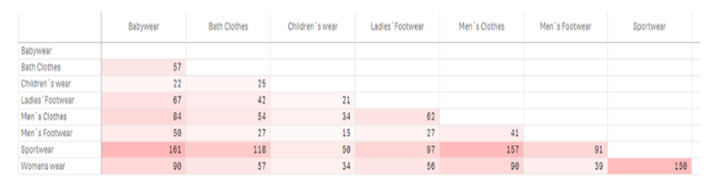
Image 9
Another and better alternative is to use a heatmap instead of a pivot table and the reason for this is because the human eye can interpret colors much faster than numbers and letters. So the process to create the product combinations is the same as the previous example, as far as the data model is concerned. The differences are:
- the use of a Heat Map chart and
- the insertion of a set analysis in the ‘measures’ section that takes into account a union:
If([ProductNames]=Duplicate,0,(count(distinct{<[ProductNames]>*<Duplicate=-{[ProductNames]}>} [TransactionID]) / count (distinct all TransactionID)))
If you want a better representation for your output, you can also add this code to the Duplicate Dimension:Dual(Duplicate,aggr(count(distinct TransactionID),Duplicate))
What this code does, is that it returns the product combination in an Descending order.
So in Image 10 you can see the end result.
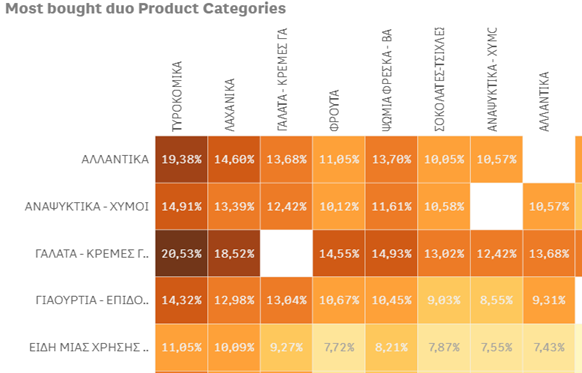
Image 10
Conclusion
In conclusion, there are many tips and tricks for Qlik Sense to choose from, that are essential, which promote the creativity of the Data Analysts/Visualization Engineers, other for speeding things up and other for making visualizations more appealing to the end user (customer).
From a simple finding of a specific field in a Data Model or an addition of a description to a visual , to a more advanced trick, such as the finding of Best-selling combinations, an Analyst can unlock and use the full power of Qlik Sense.
In times of continuous technological development, as far as the Data Analysis is concerned, the key of success is to pay attention to detail, as the end user becomes more and more intelligent by the overflow of knowledge and thus more demanding for the end result.
After all, small changes make a big difference!
For part two click here!
Christos Ksidias, Associate Business Intelligence Engineer, WITSIDE